

Madhav Packers
50.31 kW solar. 6,037 units generated every month.
- Commercial
- Rooftop solar
- Ludhiana, Punjab
- Custom packaging solutions
- 50.31 kW
- Installed capacity
- 6,037 units
- Avg. monthly generation
- 116%
- Generation vs consumption
- 28 months
- Simple payback
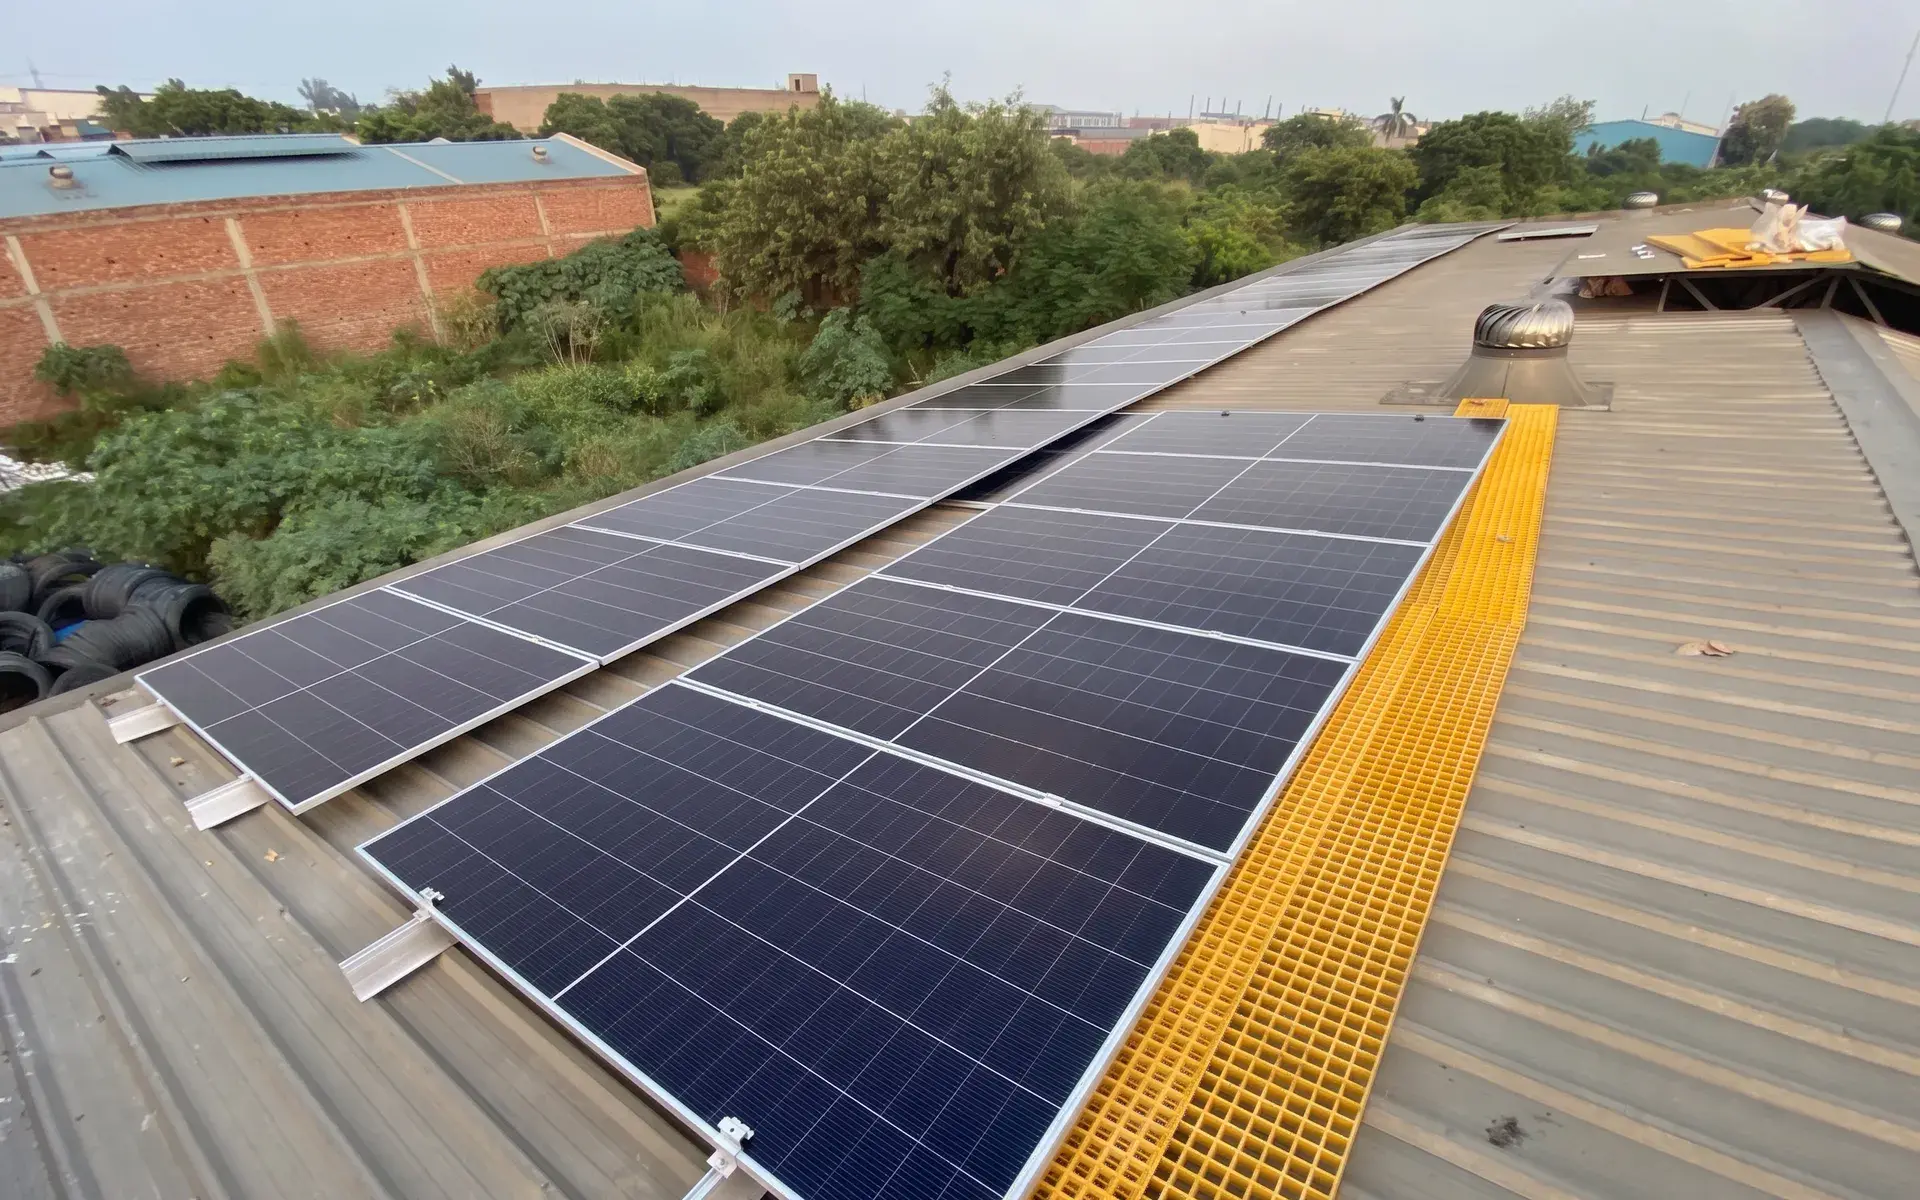
A custom packaging solutions business based in Ludhiana.
Madhav Packers is a commercial business specialising in custom packaging solutions, located in Ludhiana, Punjab. With electricity supporting its packaging and manufacturing operations, the business had an opportunity to put its tin-shed rooftop to work by generating power on-site.
A monthly electricity bill of approximately ₹40,200.
Before solar, Madhav Packers consumed approximately 5,209 units of electricity every month, with an average monthly bill of ₹40,202.
For a business with ongoing operational electricity requirements, rooftop solar offered an opportunity to generate power at the facility itself and reduce dependence on grid electricity.
A 50.31 kW rooftop solar system installed on the tin shed.
Powermore installed a 50.31 kW rooftop solar system at Madhav Packers, using Vikram Solar bifacial TOPCon modules and a Solis three-phase on-grid inverter.
- Modules
- Vikram Solar NON-DCR 585 Wp TOPCon Bifacial
- Inverter
- Solis 50 kW Three-Phase PV Solar Inverter (S6-GC3P50K04-NV-ND)
- Location
- Ludhiana, Punjab
- Roof type
- Tin shed
- Average monthly generation
- 6,037.2 units
- Sanctioned load
- 60 kVA
- 01Generate
N-Type TOPCon modules on the tin shed roof
- 02Convert
Solis 50 kW Three-Phase PV Solar Inverter (S6-GC3P50K04-NV-ND)
- 03Self-consume
Site load is served first, behind the meter
- 04Save
Generation equal to 116% of reported monthly use
A rooftop generating more electricity than the facility's reported monthly consumption.
The solar system is expected to generate approximately 6,037 units every month. Against the pre-solar consumption of 5,209 units/month, that is equivalent to approximately 116% of the facility's reported monthly electricity consumption.
This creates the potential to meet the facility's electricity requirements through solar generation, subject to when the power is generated and consumed, and the applicable grid and export arrangements.
The numbers behind the installation.
The project has an estimated 28-month simple payback period, making rooftop solar a long-term investment in managing electricity costs.
- Pre-solar monthly bill: ₹40,202
- Pre-solar consumption: 5,209 units/month
- Effective pre-solar electricity rate: ₹7.72/unit
- Average monthly solar generation: 6,037.2 units/month
- Generation above reported monthly consumption: 828 units/month
- Simple payback: 28 months
What the numbers actually show.
- 01Making productive use of available rooftop space.
The 50.31 kW installation turns Madhav Packers' tin-shed rooftop into an on-site source of renewable electricity.
- 02Solar generation exceeds reported monthly consumption.
With average generation of approximately 6,037 units/month against reported consumption of 5,209 units/month, the system has the potential to meet the facility's energy requirements, subject to consumption patterns and grid arrangements.
- 03A defined investment recovery period.
With a simple payback period of approximately 28 months, the project offers a clear timeline for recovering the solar investment.
Before solar, and with solar.
| Metric | Before solar | Solar system |
|---|---|---|
| Monthly electricity consumption | 5,209 units | N/A |
| Monthly electricity bill | ₹40,202 | N/A |
| Installed solar capacity | N/A | 50.31 kW |
| Average monthly solar generation | N/A | 6,037 units |
| Solar generation vs consumption | N/A | 116% |
| Simple payback | N/A | 28 months |
Solar generation exceeds the facility's reported monthly consumption. Actual savings will depend on generation timing, self-consumption, fixed and demand charges, taxes and applicable grid arrangements.
The installation in photos.
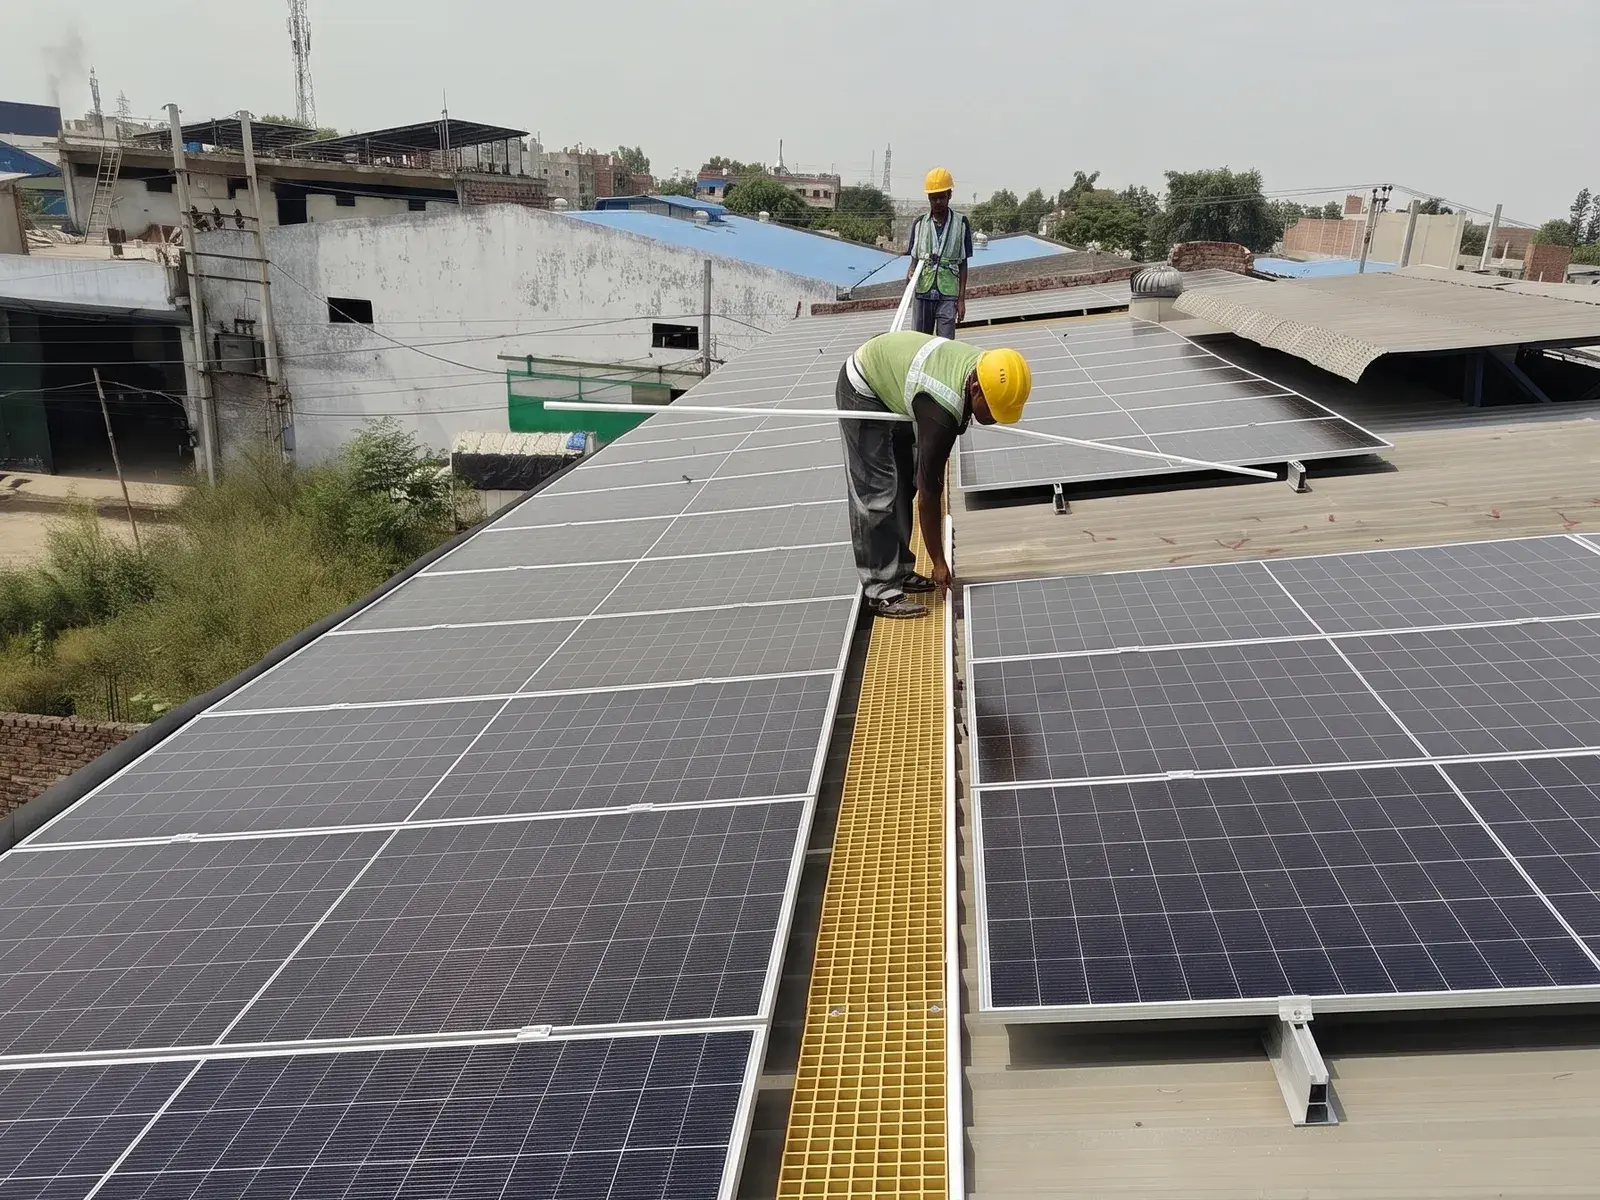
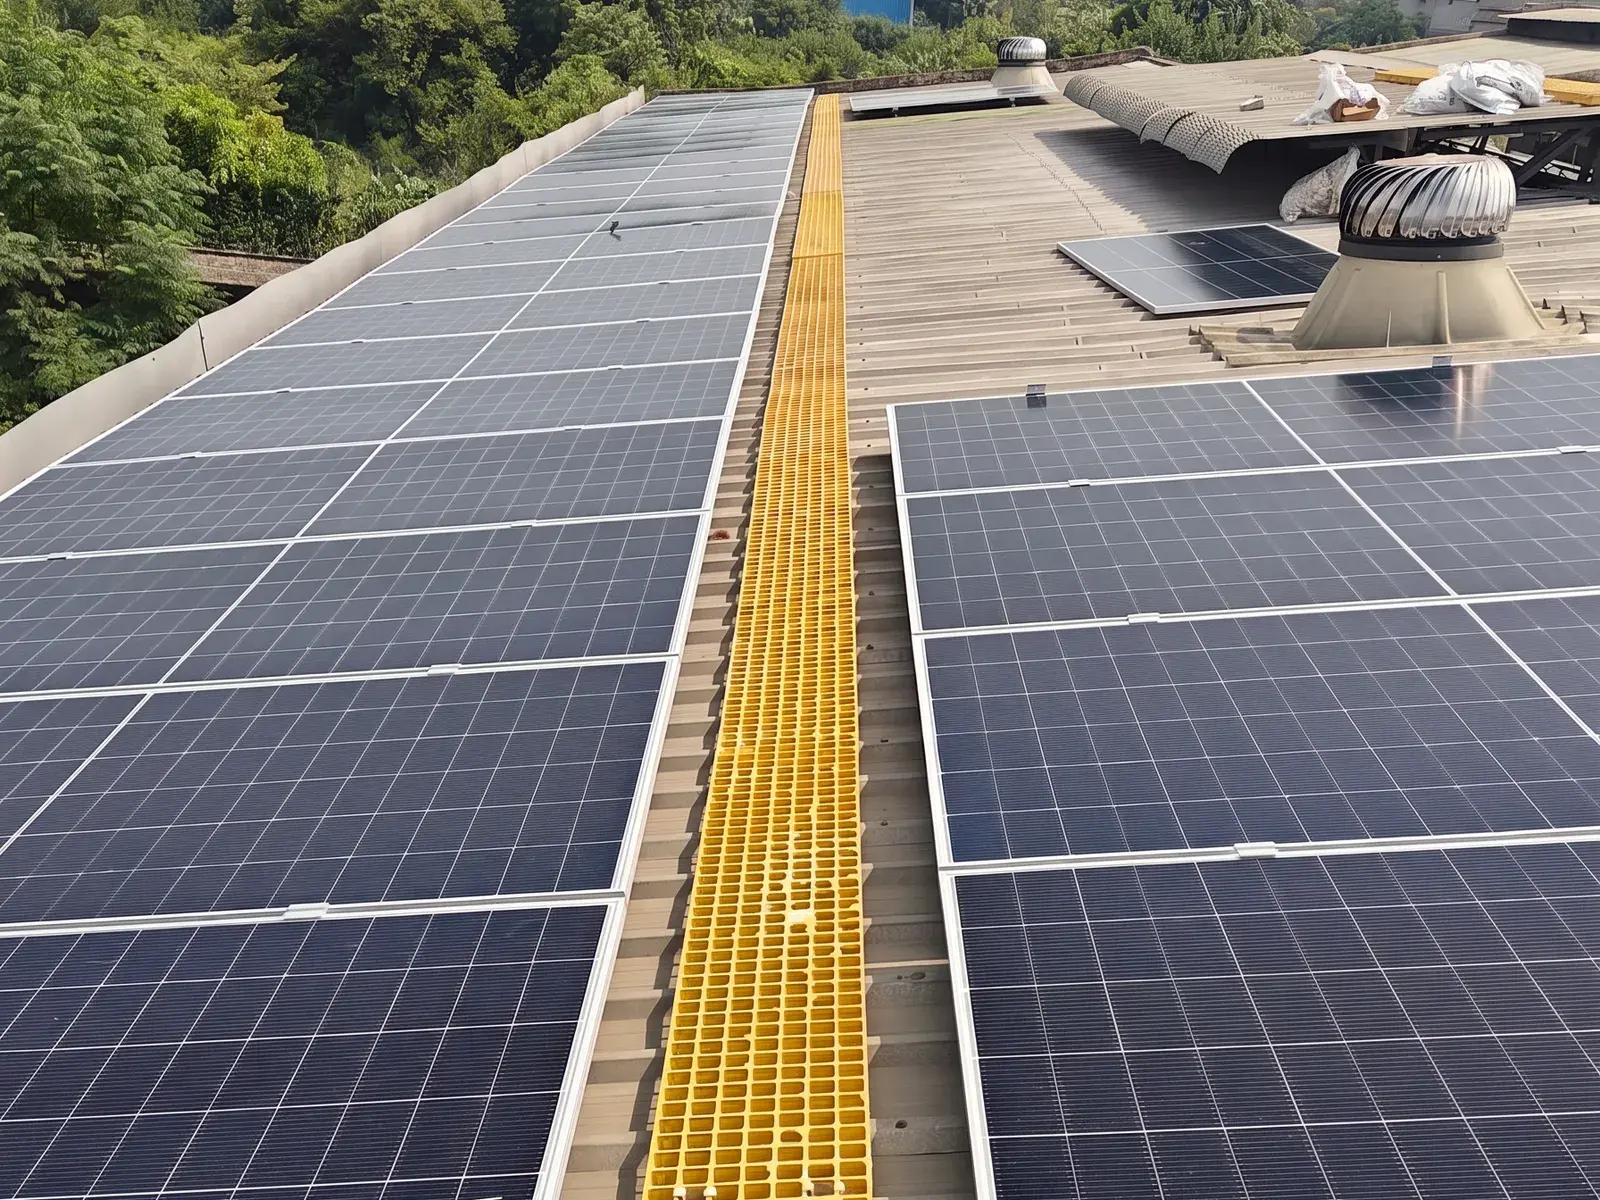
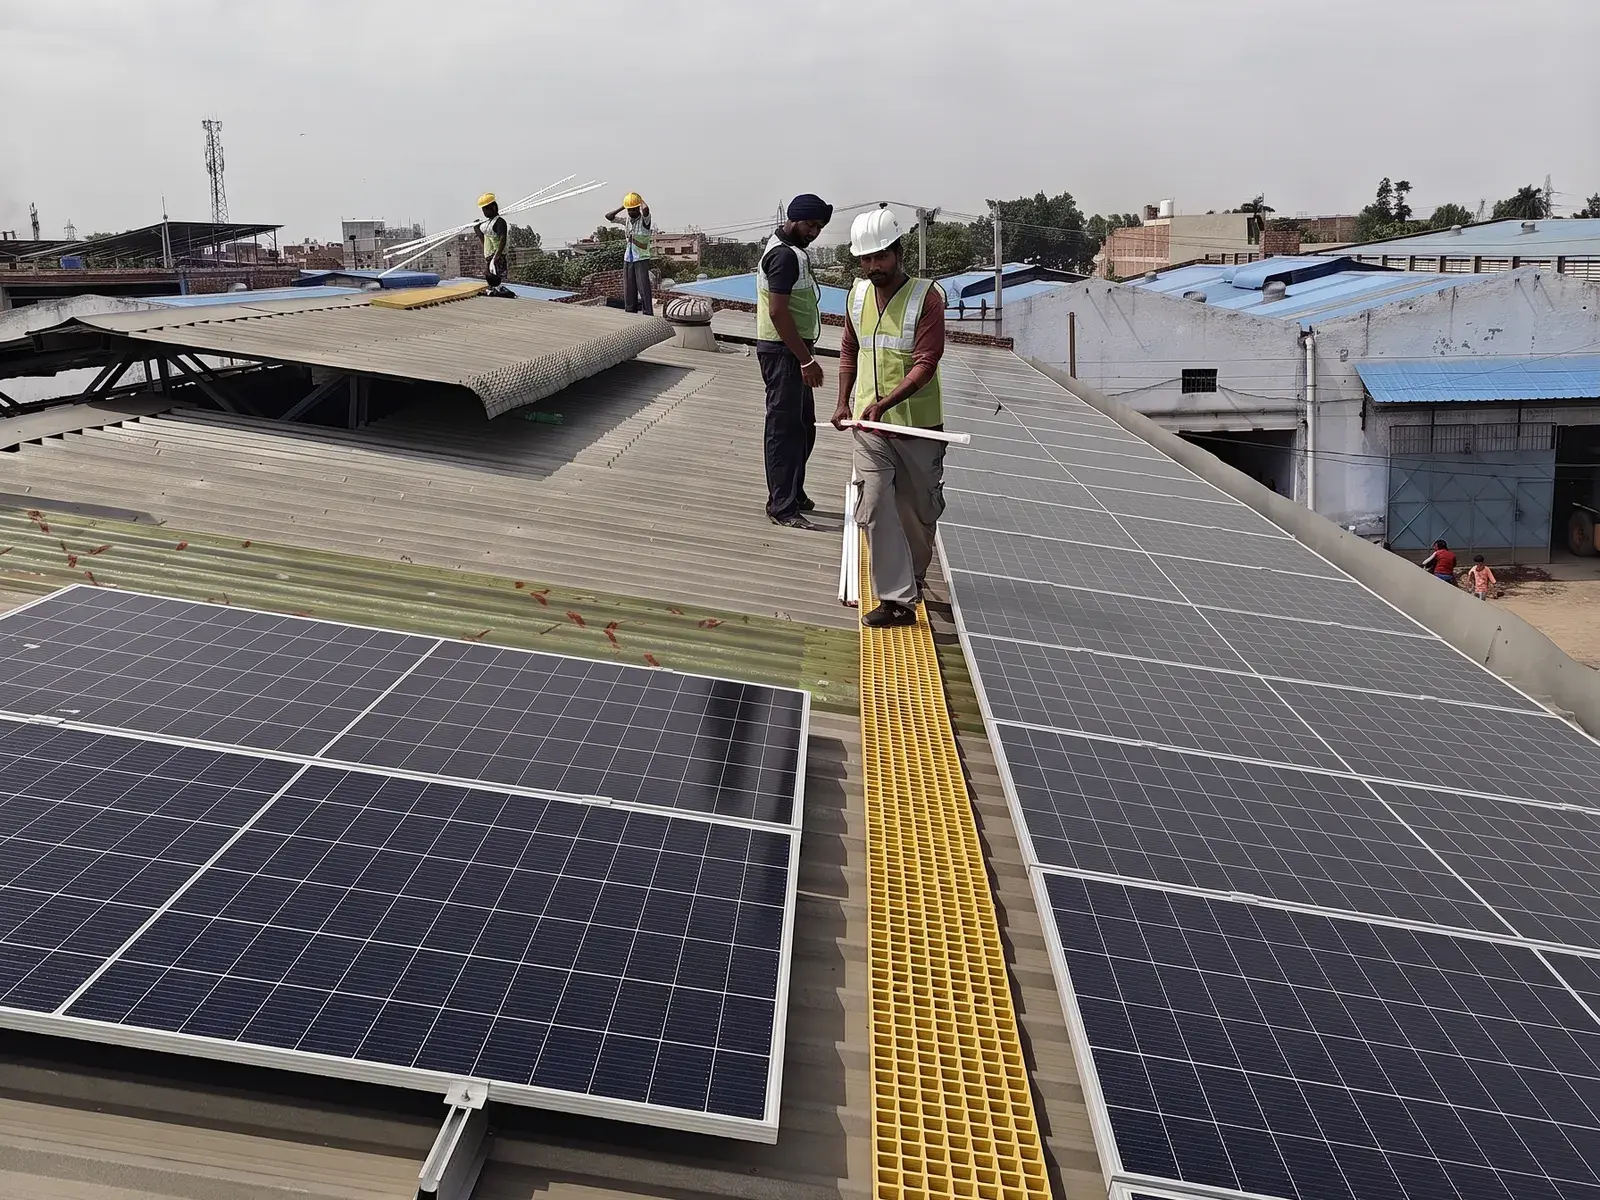
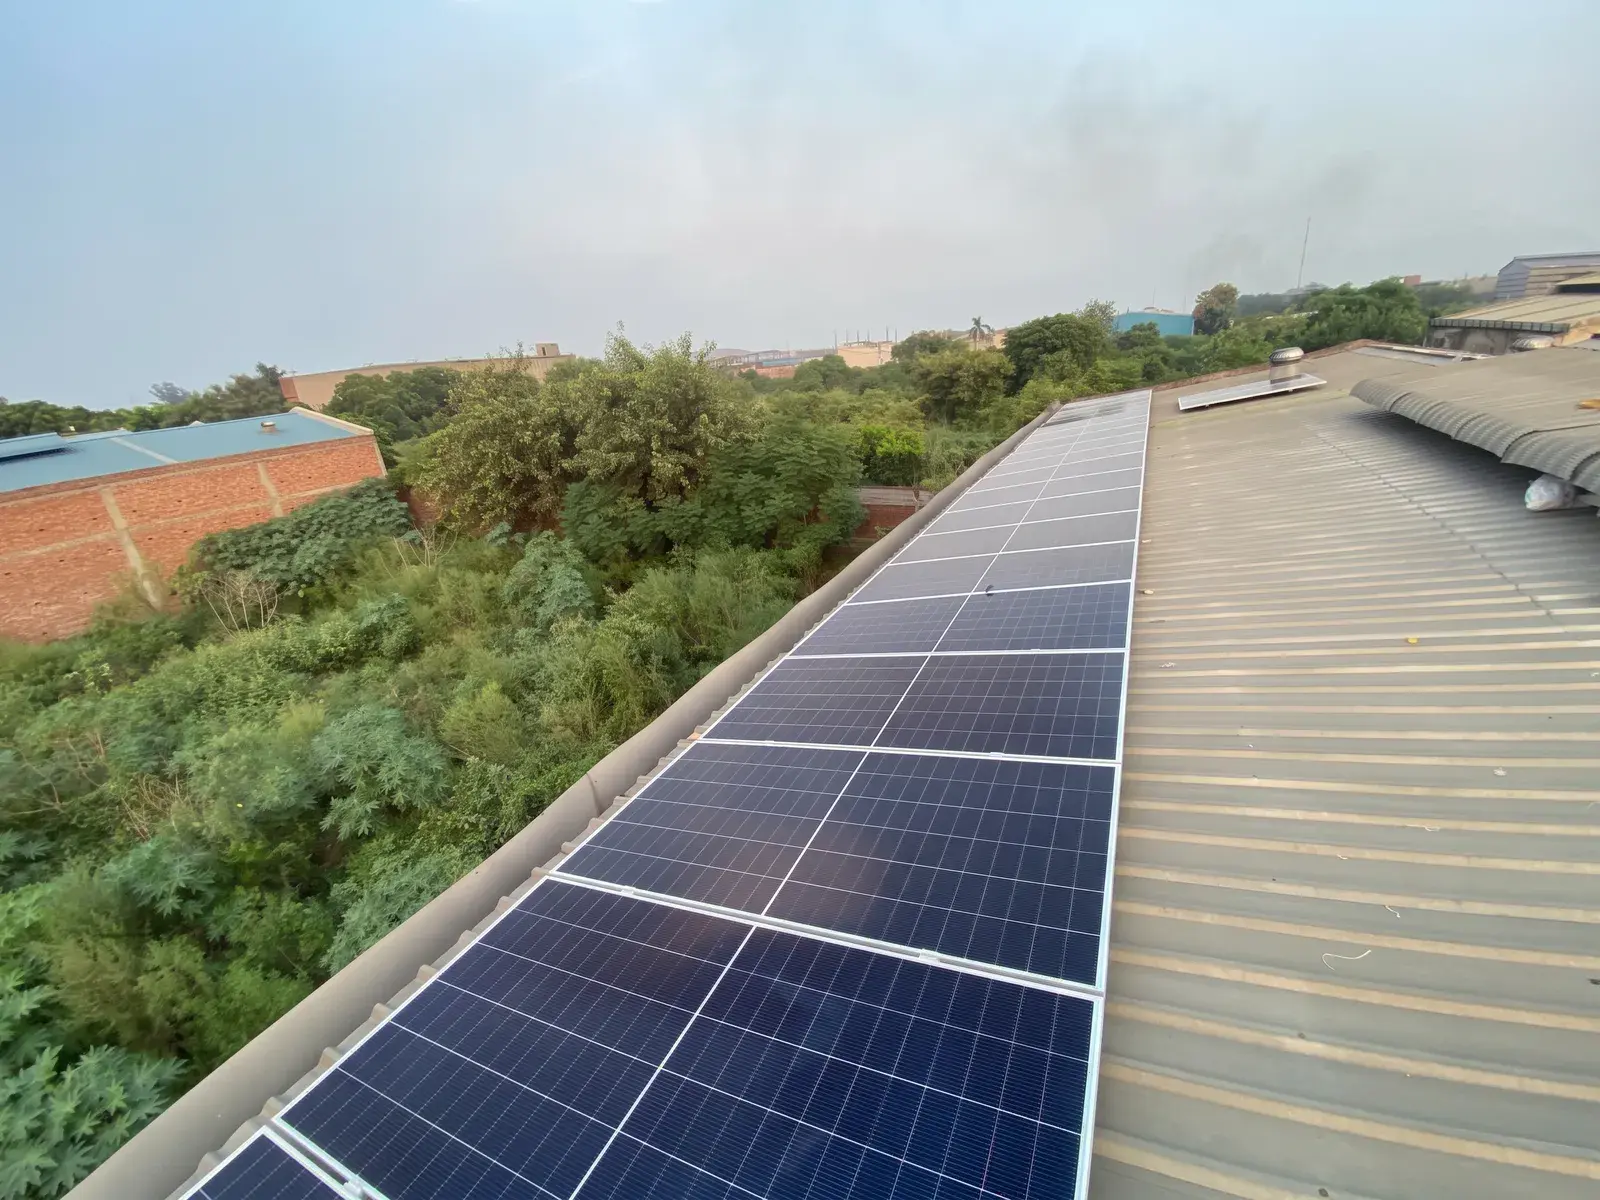
Turning available rooftops into productive energy assets.
For businesses, electricity is an essential part of daily operations and a recurring operating expense. Madhav Packers' rooftop solar installation demonstrates how available industrial roof space can be put to work to generate electricity on-site.